Sensor and Server
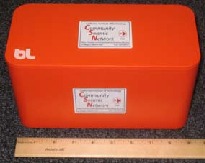
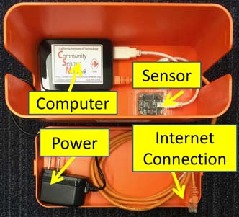
CSN Sensor Package Detail
The CSN sensor package consists of a 3-axis, class-C MEMS accelerometer (currently a Phidget 1056-1) and Linux micro-computer (Raspberry Pi 4b). The sensor has a native sampling rate of 250 samples per second (sps), which is decimated in the microcomputer to 50 sps to reduce the data volume and to ensure the device does not function in the audible range.
The package maintains time synchronization through Network Time Protocol (NTP), that is further refined by resampling the signal between fixed time points. The use of NTP to maintain time rather than GPS-based mechanisms allows the sensor to be deployed without a sky view (i.e. indoors). Most sensor deployments include a small uninterruptible power supply (UPS) device to allow operations to continue during power outages of several hours. Sensors are affixed to the floor with two-sided sticky pads.
Custom software running in the microcomputer (client software) manages the accelerometer data sampling, decimating, buffering, time synchronization, and communicating with the cloud. It also performs higher-level processing of the signal such as picking (event detection and computation of peak acceleration values) and ground motion parameter estimation. It archives the data on a local SD card in case of an Internet failure. The software is written in Python and is remotely updatable.
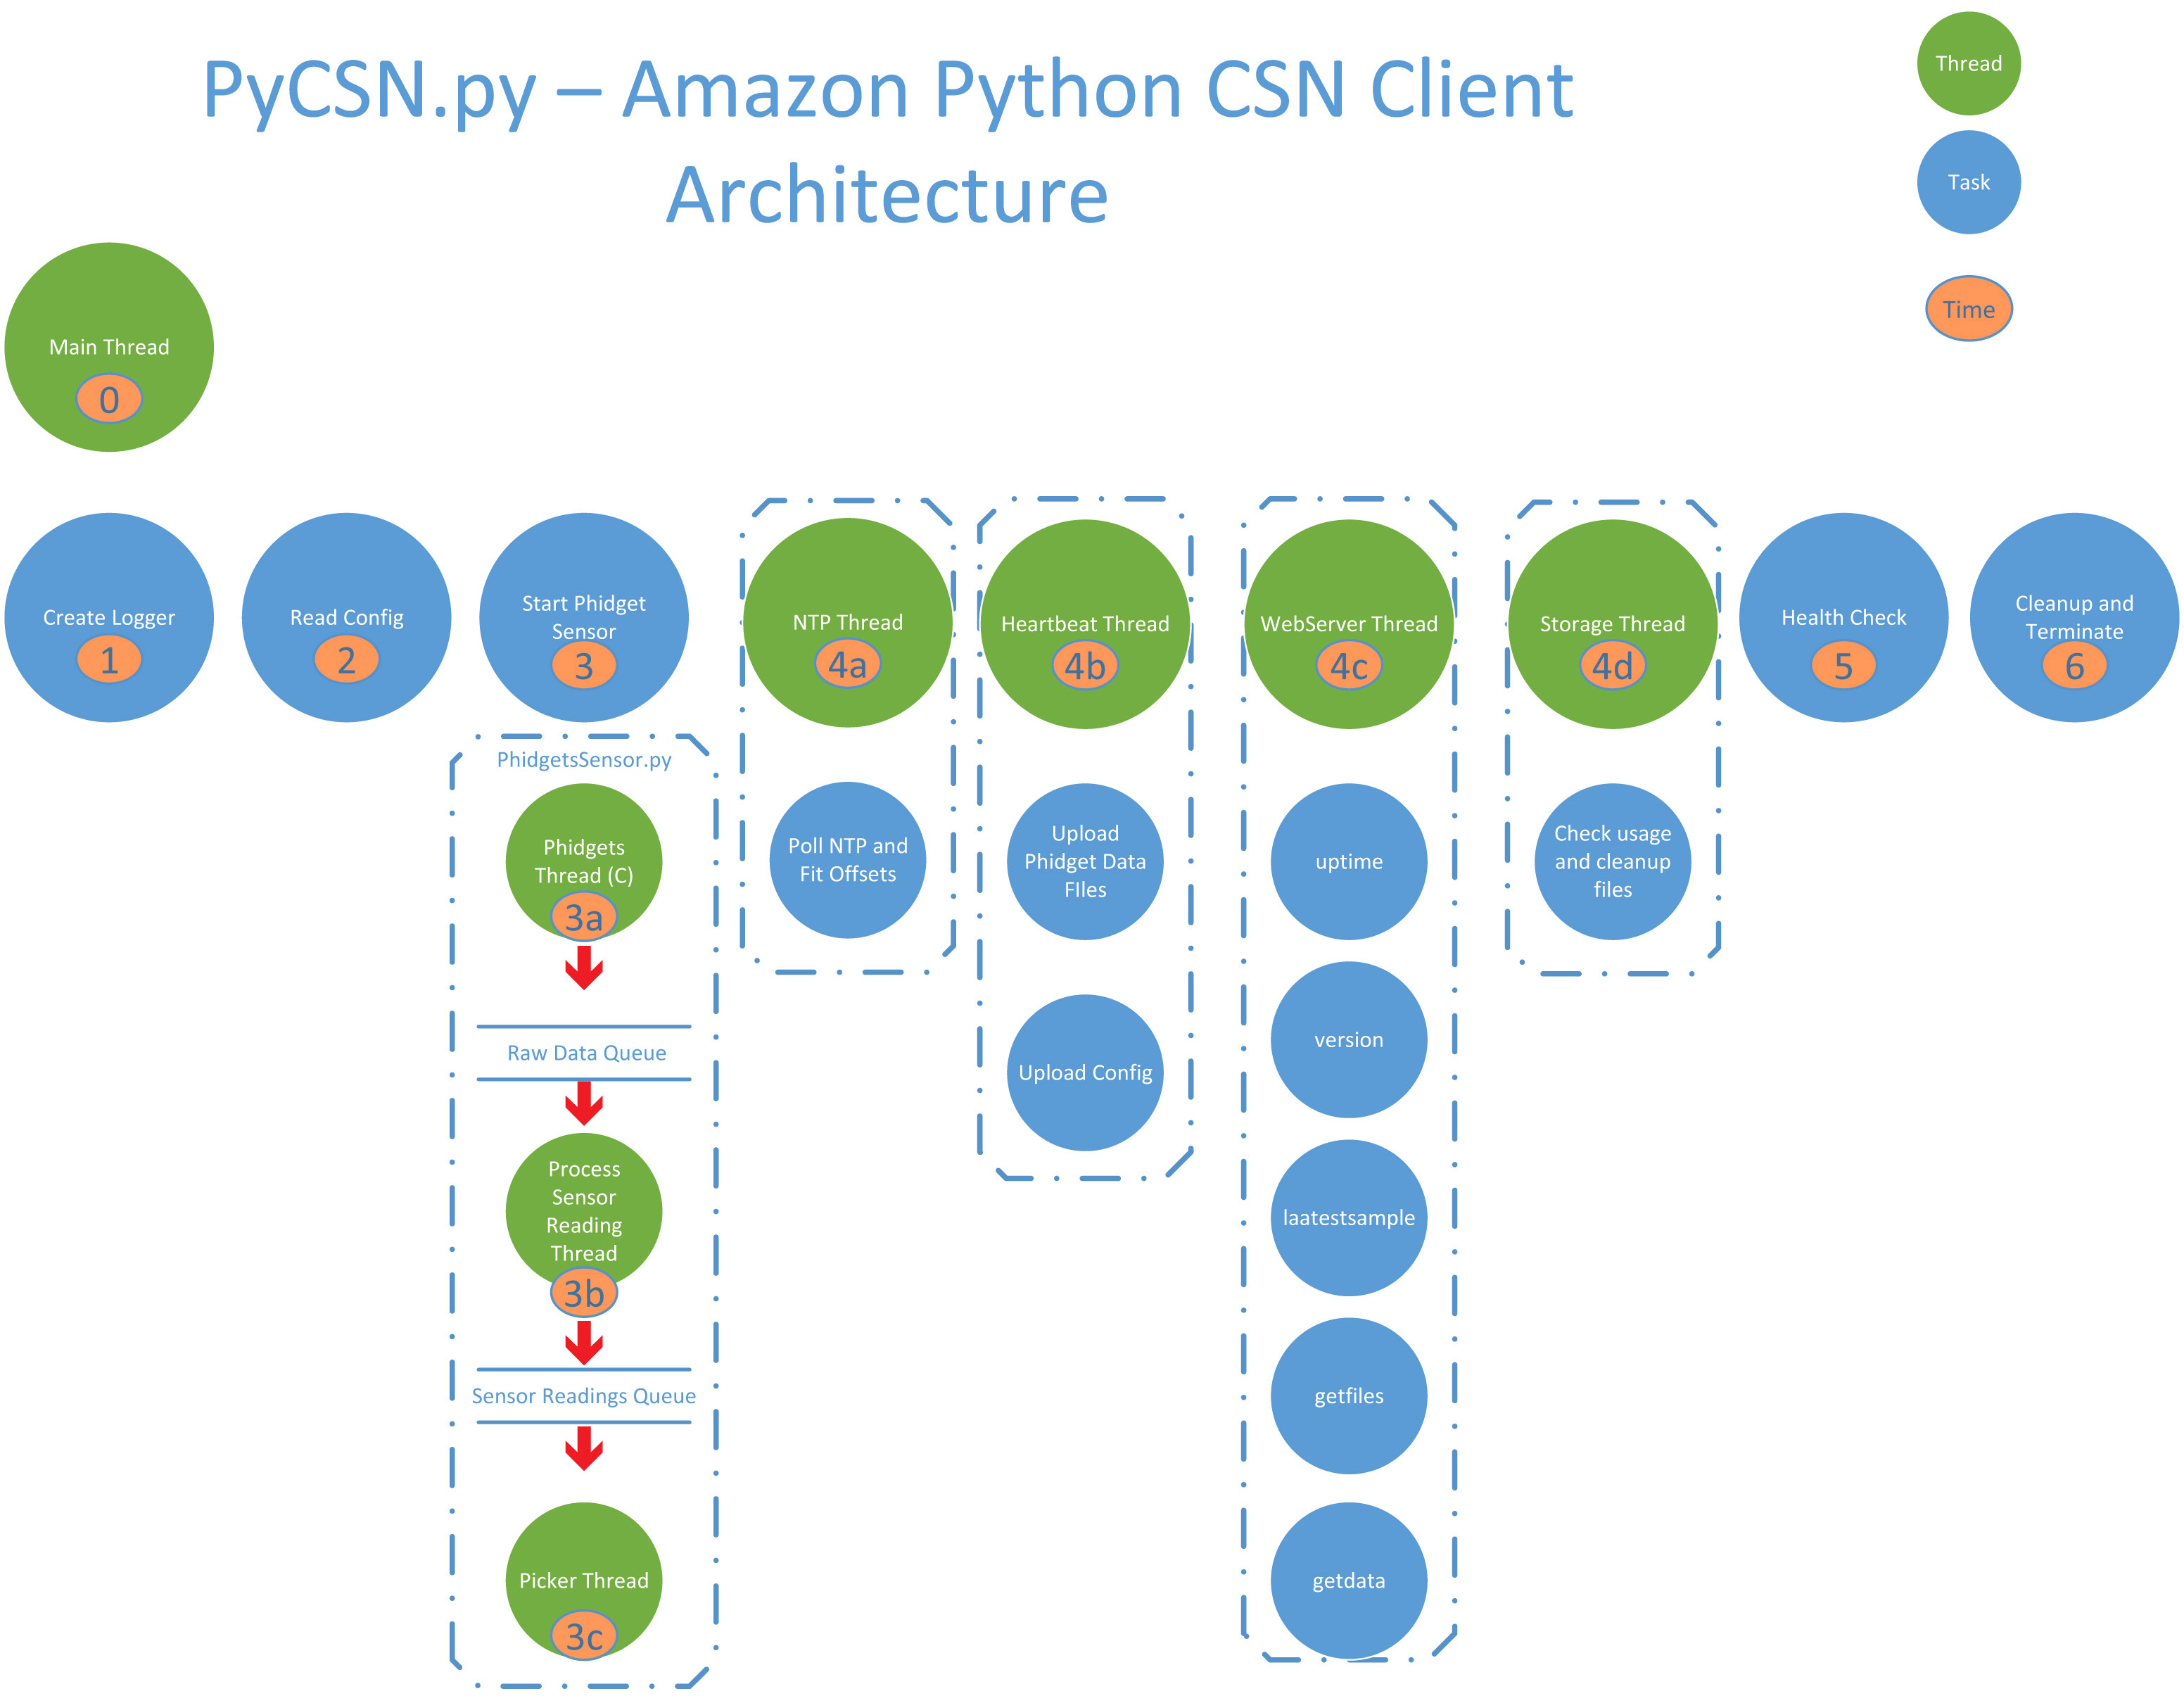
Schematic of the client software (in Python)
The client software performs an earthquake detection analysis (picking) on the incoming data and will trigger whenever the acceleration exceeds a station-configurable factor, typically 0.005g. A trigger initiates a process to measure pick attributes such as the peak acceleration and its onset time in the following 3 seconds. It is planned that the process will also determine the Earthquake Early Warning (EEW) measurements. The pick information is then sent immediately to an ActiveMQ process in Amazon Cloud Services (AWS). The latency of the pick transmission is very small. The waveform data is sent at regular intervals to AWS (typically every 10 mins). This setup allows the client to respond quickly to an earthquake, but otherwise use low-overhead communication.
Sensor Accuracy and Sensivity
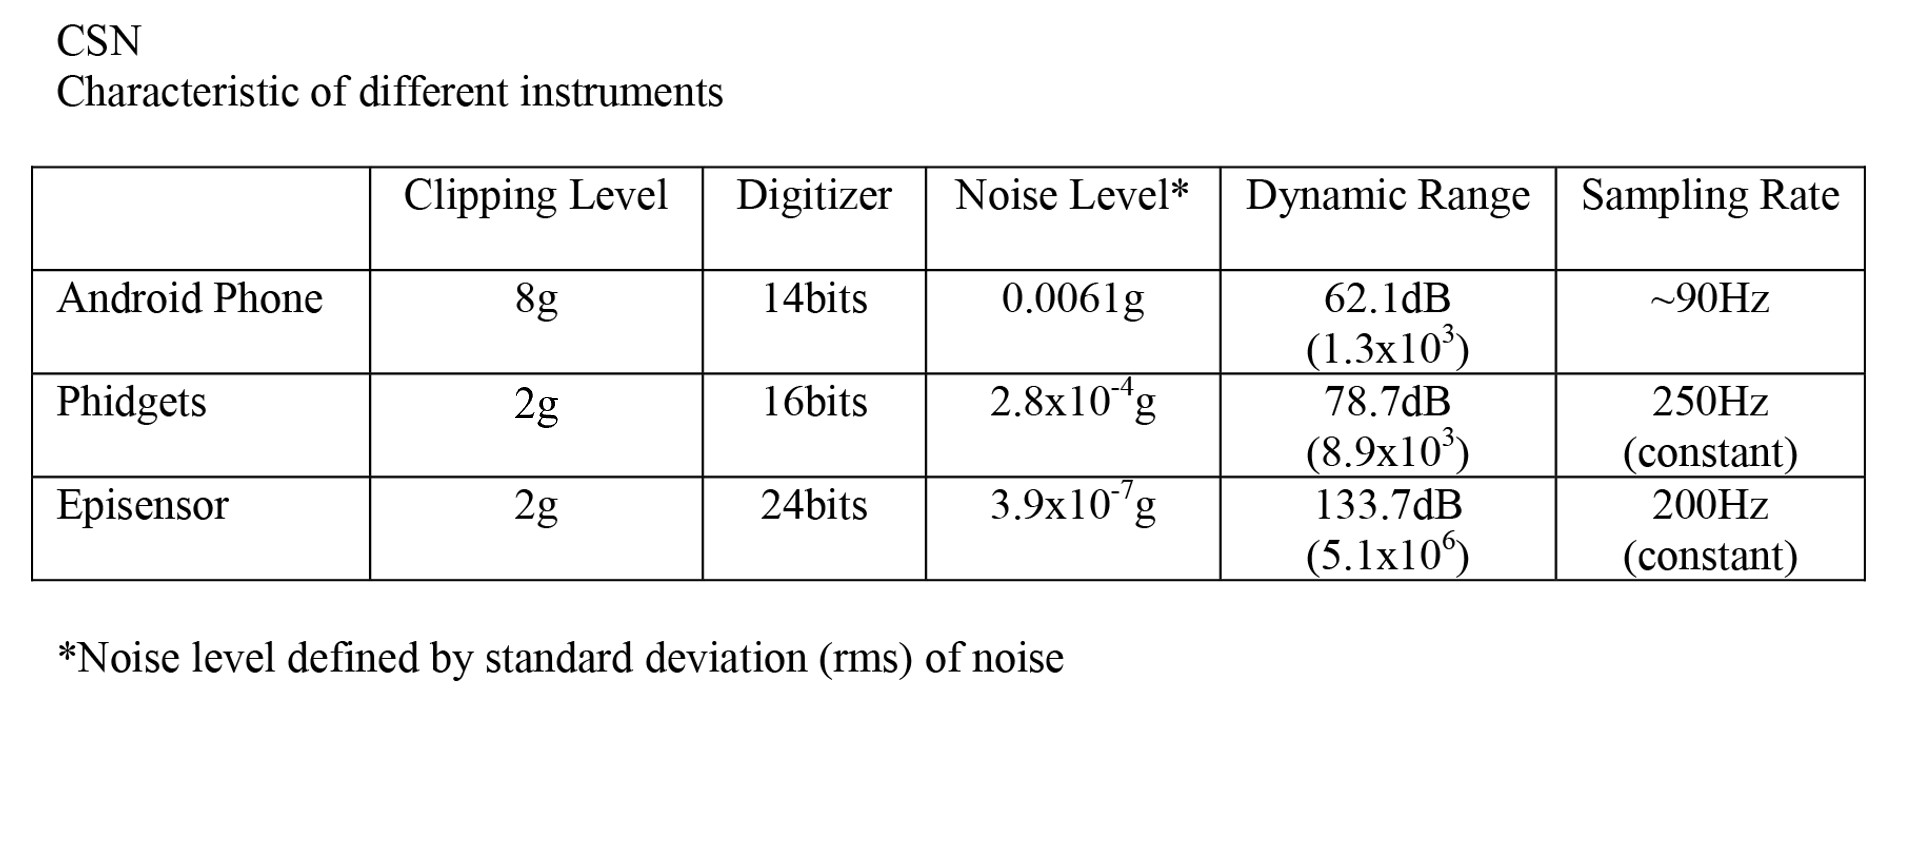
The CSN package currently uses the Phidget 1056-1 sensor. A table showing the comparison between this class-C sensor, a class-A sensor (Episensor), and a cell-phone accelerometer is shown below.
Sensitivity vs Distance/Magnitude
The frequency-magnitude performance of the sensor is shown in the following plot. For example, the Phidget is sensitive to magnitude 3.5 and above at a distance of 10 km, but the Android phone requires magnitude 5 for the same distance.
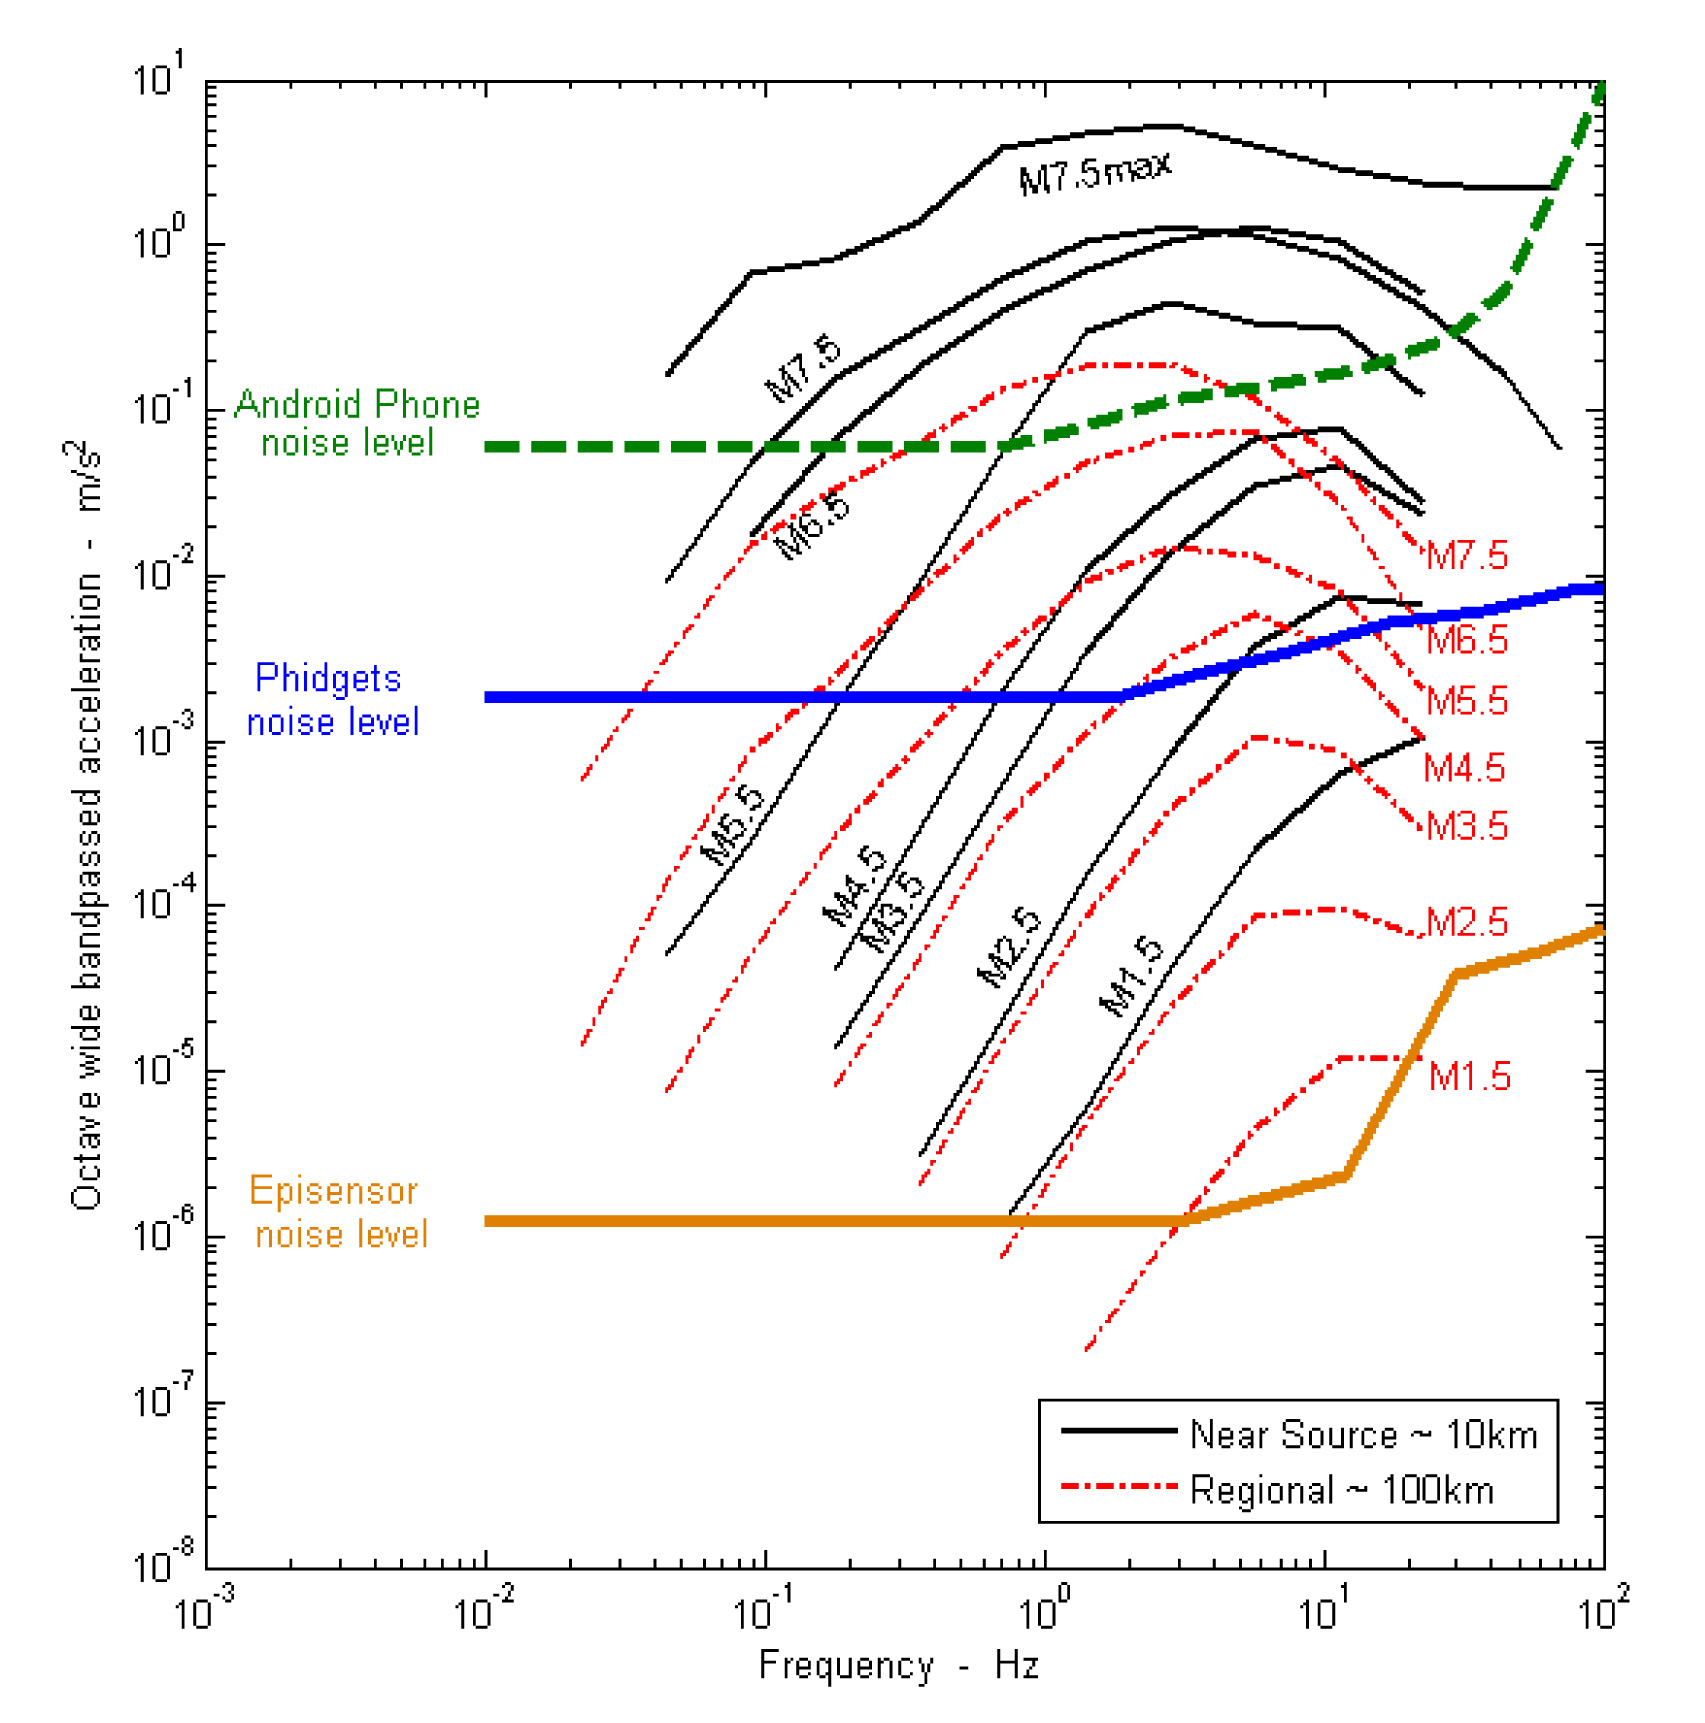
The response of the CSN Phidget sensor and that of a typical smart phone are compared to a standard high-quality force-balance accelerometer (Episensor). The responses for various sized earthquakes at two distances are shown for reference. Figure is from Clayton, R., T. Heaton, M. Chandy, A. Krause, M. Kohler, J. Bunn, R. Guy, M. Olson, M. Faulkner, M. H. Cheng, L. Strand, R. Chandy, D. Obenshain, A. Liu, and M. Aivazis, Community Seismic Network, Annals of Geophysics, 54 (6), doi: 10.4401/ag-5269, 2011.
Comparison of CSN with Episensor
This example below shows a side-by-side comparison of the CSN sensor and an Episensor accelerometer colocated in the Pasadena Seismic Vault. The event is the 2014/03/29 La Habra earthquake (magnitude 5.1), whose epicenter is 25 km away.
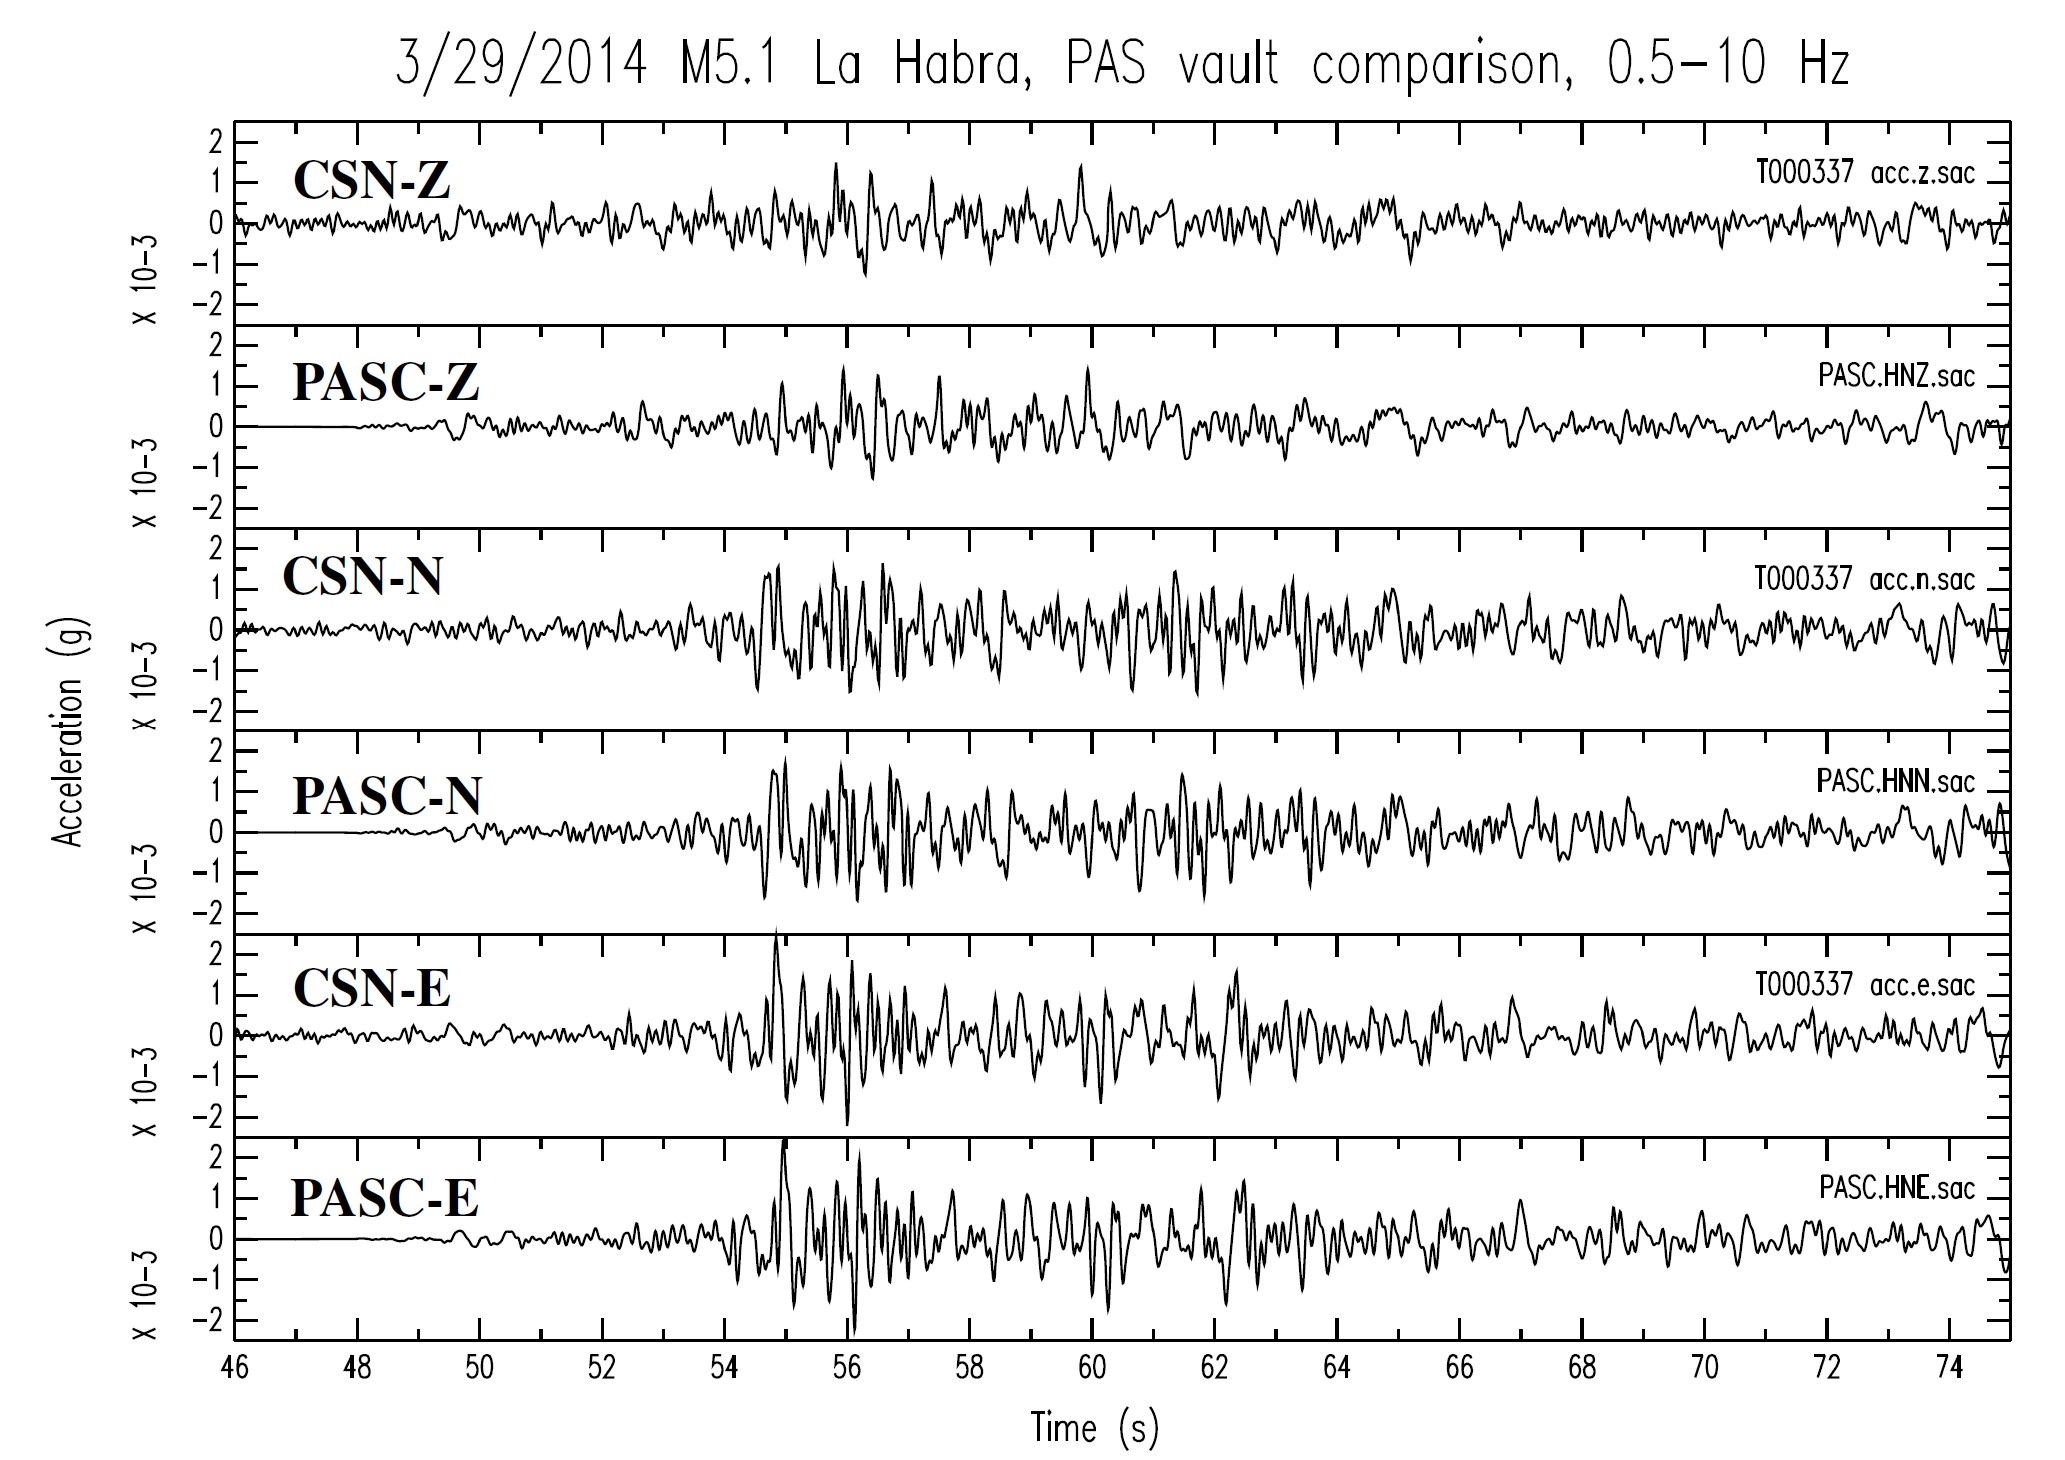
Comparison of CSN accelerometer ("CSN") with an EpiSensor accelerometer ("PASC"). The recordings of the 2015 Mw 5.1 La Habra earthquake are made on the pier of the Pasadena station PASC. Figure is from Clayton, R. W., T. Heaton, M. Kohler, M. Chandy, R. Guy, and J. Bunn, Community Seismic Network: a dense array to sense earthquake strong motions, Seis. Res. Lett., 86, 1354-1363, doi: 10.1785/0220150094, 2015.
A side-by-side comparison of a number of class-C sensors is given by: Evan, J. R. et al, (2014), Performance of Several Low-Cost Accelerometers, Seismological Research Letters 85, 1 pp147-158, doi:10.1785/0220130091
Cloud Data Processing and Analytics
Data Archiving
After the waveform data have been initially sent to the cloud, they are downloaded to a server facility at Caltech for analysis, archival and distribution purposes. The data are stored in 10-minute chunks in SAC (Seismic Analysis Code) format. A database is kept of the individual waveform files, and of the station metadata. A server application delivers these data to users by cutting and joining the waveform segments into user-requested time windows. The request produces data that can be streamed over the internet to the user's computer.
The 'pick' data from events detected in real time (by each of the stations so configured) are sent to the cloud and stored there in a cache. Each pick consists of a short message that includes information about the size of the event, the location of the station detecting it, and an accurate timestamp of when the event occurred. The cache is regularly emptied by a server facility at Caltech. This process incorporates two functions, the first of which is to store all the picks in a database, for analysis, archival and distribution purposes, and the second of which is to relay the real-time picks to remote clients. These clients currently comprise the Earthquake Early Warning system's FinDer [Bose et al., GJI, 2012] and PLUM (Cochran et al., BSSA, 2019) application, and the ShakeMap [Worden et al., ShakeMap Technical Manual, 2020] system that produces maps of regional ground motion.
Data Analytics
For each 10-minute chunk of waveform data we compute the average, the mean, the median, and the root-mean-square values, and store these in a database. These parameters give a measure of the average performance of the station, and its noise environment. For select stations we compute the average H/V (horizontal/vertical) ratio as a function of frequency in order to determine the shallow site characteristics.
Real-Time Monitoring
The software executing in each of the stations includes features that allow it to be interrogated and controlled over the network. Interrogations include demands for the latest sensor data, the latest pick events, the elapsed time since the software started execution, demands for information about the station's configuration (its 'metadata'), and so forth. In some cases, the responses to interrogations are in the form of raw ASCII text, in other cases they are JSON encoded data, and in still others they are Web HTML data that will render charts, for example in the requester's browser. One use case for the real-time monitoring data is a so-called 'Building Display', an application that requests pseudo-real-time data from all the stations in a specific building, and renders the data graphically and dynamically to show, for example, the motion of each of the building's floors and inter-story drifts in real time.
Data Quality Control
A suite of software tools is used to regularly monitor the quality of the data in the system. These tools include scripts that produce graphical schematics showing the completeness of data produced, sent to the cloud, downloaded, and archived into storage. The tools include scripts that tabulate the status of all stations in the system, showing whether they have produced waveform data and pick data, and when the most recent communication was received from each station. The schematics and reports are sent to the system's operations managers on a regular basis. In addition to the regular monitoring of the data by the aforementioned tools, data quality control may also be monitored in some cases by observation of the real-time displays described in the previous section.